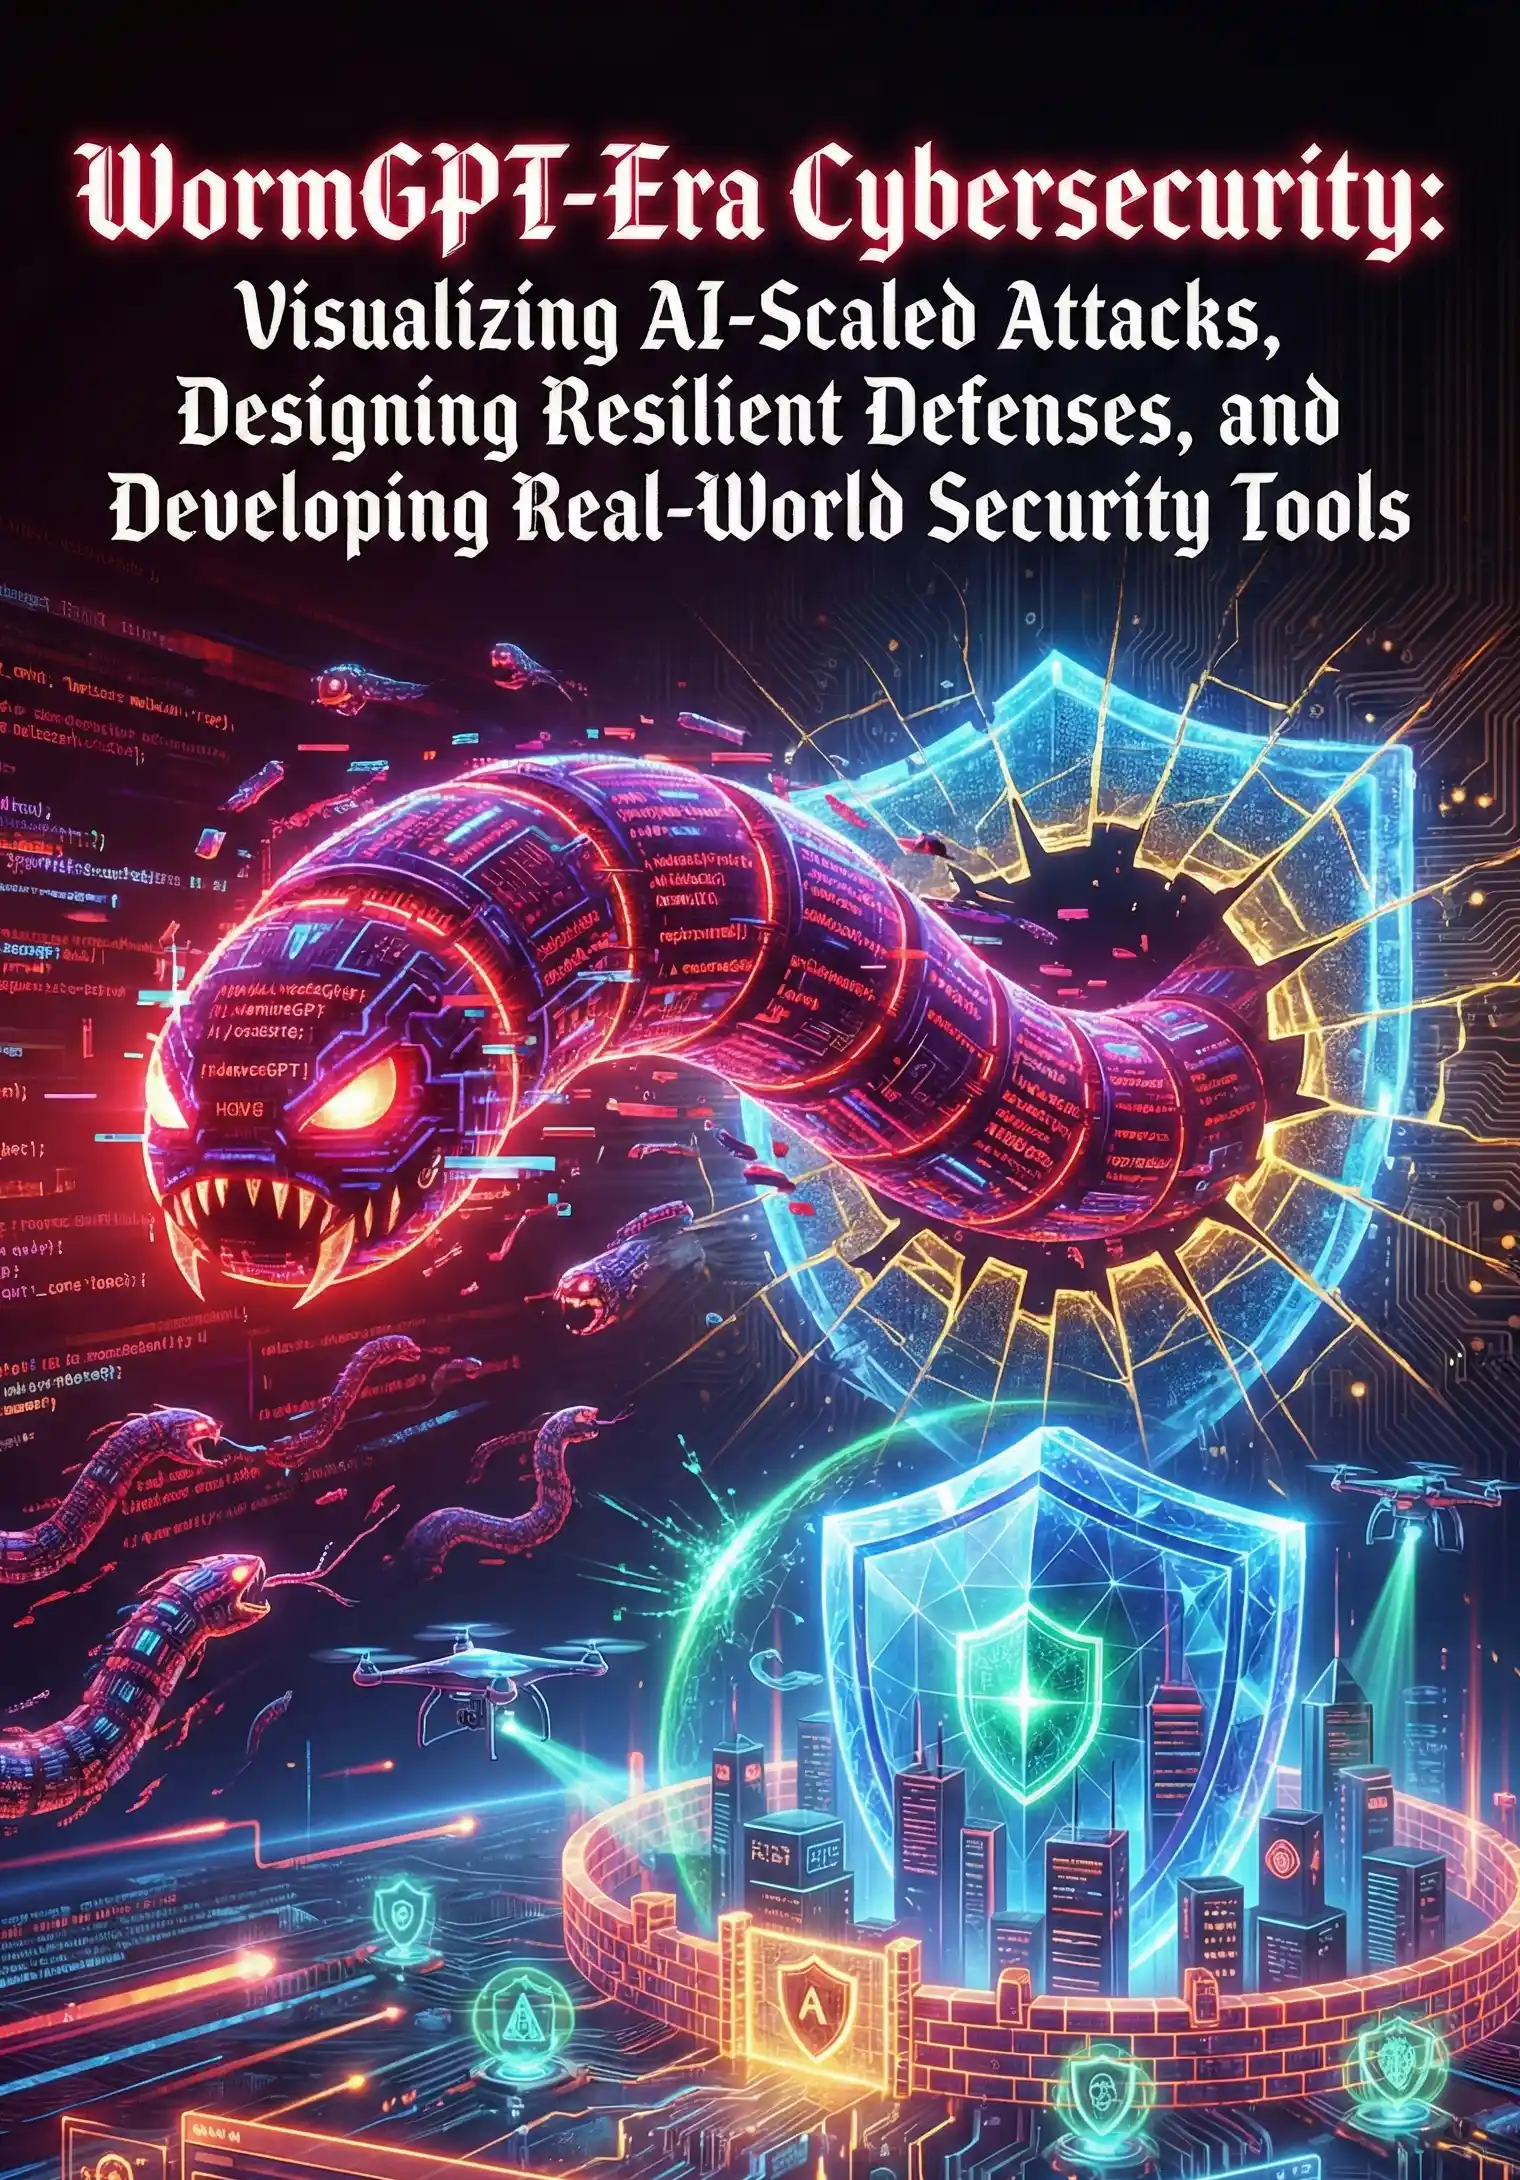
In the WormGPT era, the speed, scale, and sophistication of cyber threats have rendered traditional security monitoring paradigms obsolete. Security teams are inundated with data from a myriad of sources, and the challenge is no longer data collection but data comprehension. The modern Security Command Center, or Security Operations Center (SOC), requires more than just displays of metrics; it needs a cognitive nexus—an actionable dashboard that transforms a deluge of hyperscale attack data into clear, decisive intelligence. This section delves into the principles and practices of designing such dashboards, shifting the focus from passive data presentation to active decision enablement.
An effective cybersecurity dashboard is not measured by the number of charts it contains, but by the speed and accuracy of the decisions it facilitates. Three core principles guide the design of truly actionable dashboards.
1. The Principle of Least Cognitive Load: Every element on a dashboard should serve to reduce, not increase, an analyst's mental workload. The goal is to make the correct interpretation of data effortless. This involves using pre-attentive attributes like color, size, and position to draw attention to critical anomalies. Instead of showing a raw log count, visualize the deviation from a baseline. Adhering to principles from data visualization experts like Edward Tufte ensures that the visualization is clean, accurate, and free from distracting 'chartjunk'. The analyst should see the threat, not the tool.
2. Context is King: Data without context is merely noise. An actionable SIEM dashboard must enrich raw event data with critical business and threat context. An IP address is just a number until it is correlated with threat intelligence feeds (identifying it as a known command-and-control server), asset management data (linking it to a critical database server), and identity information (associating it with a privileged user account). Effective threat intelligence visualization layers this context directly onto the event data, allowing an analyst to immediately grasp the severity and potential impact of an alert.
3. From Visualization to Action: The ultimate goal is response. A dashboard should be the starting point, not the endpoint, of an investigation. This principle emphasizes deep integration with the security ecosystem. An alert on a dashboard should offer one-click pivots to the raw logs in the SIEM, direct links to device information in an EDR console, or the ability to trigger a Security Orchestration, Automation, and Response (SOAR) playbook directly from the visualization. This tight SOAR integration transforms the dashboard from a passive monitoring tool into an active response console.
A single dashboard cannot effectively serve the needs of every role within the security organization. A tiered architecture ensures that information is tailored to the responsibilities and decision-making framework of each stakeholder, from the front-line analyst to the CISO.